Understanding your Analytics page
Where to find Analytics, how the page is organized, and what each tab covers.
Written By Nick
Last updated About 2 months ago
Analytics is where you see how your content is performing without leaving Social Valet or bouncing between platform dashboards.
This article covers where to find it, how the page is organized, and what each tab is for.
Where to find Analytics
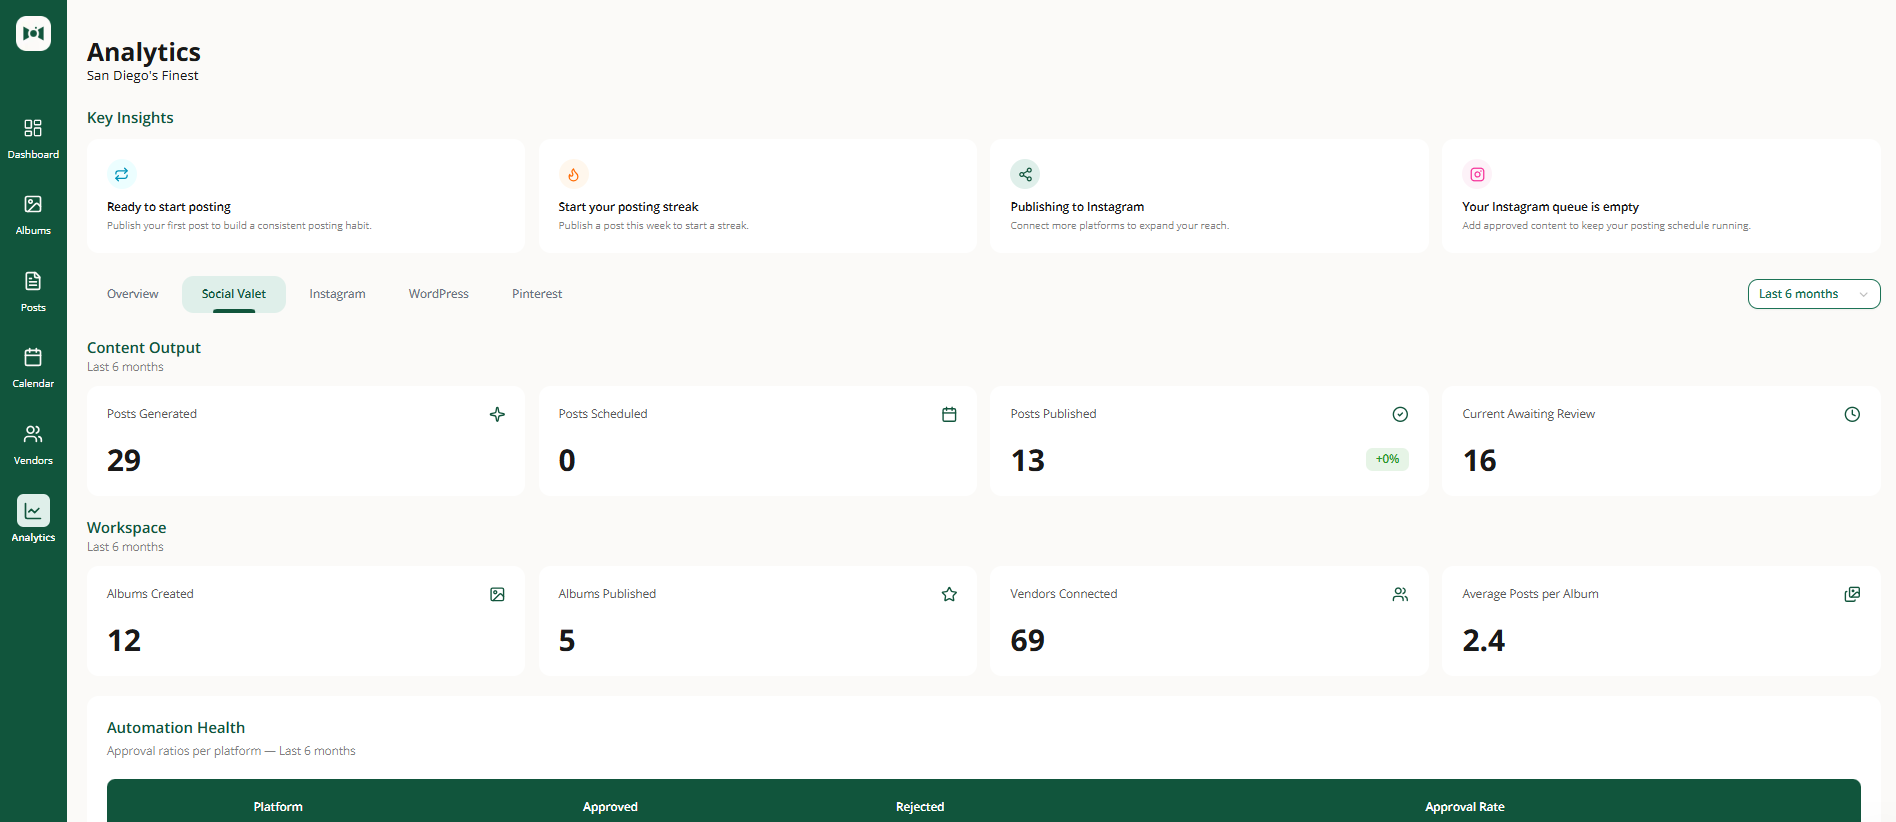
Analytics lives in the main navigation. Click Analytics in the sidebar (or the bottom nav on mobile) to open it.
The page opens on the Overview tab by default. You can switch tabs from the tab bar at the top.
What the tabs cover

Overview. The single-glance summary. Reach, engagement, publishing volume, time saved, and your top-performing content across every connected platform.
Instagram. How your Instagram account is doing specifically. Follower changes, per-post performance, and posting cadence.
Pinterest. Pin performance, save activity, and how your boards are doing.
WordPress. Blog traffic, top posts, and publishing volume.
Social Valet. How Social Valet itself is contributing behind the scenes: content generated, workspace activity, automation health, and vendor collaboration.
If a platform isn't connected, its tab still shows but explains what's missing and links you to the connection article.
Key Insights

At the top of every tab you'll see Key Insights: a short list of the most useful takeaways from your current data. These update as your data changes and are meant to save you from having to hunt for meaning in the numbers.
Key Insights currently highlight things like posting habits, streaks, connected platforms, and Instagram queue health.
Using Analytics on your phone
Analytics is mobile-friendly. Tabs, tables, and charts all reflow for smaller screens so you can check performance during a break without pulling out a laptop.
How fresh the data is
Platform metrics update daily. Social Valet activity metrics update in near-real-time.